
Bright Star Schools is closing the achievement gap! At surrounding public schools, only 20 percent of socio-economically disadvantaged students met or exceeded state standards in ELA and only 14 met or exceeded them in Math. Comparatively, 47 percent of Bright Star’s socio-economically disadvantaged students met or exceeded state standards in ELA and 36 percent met or exceeded them in Math.
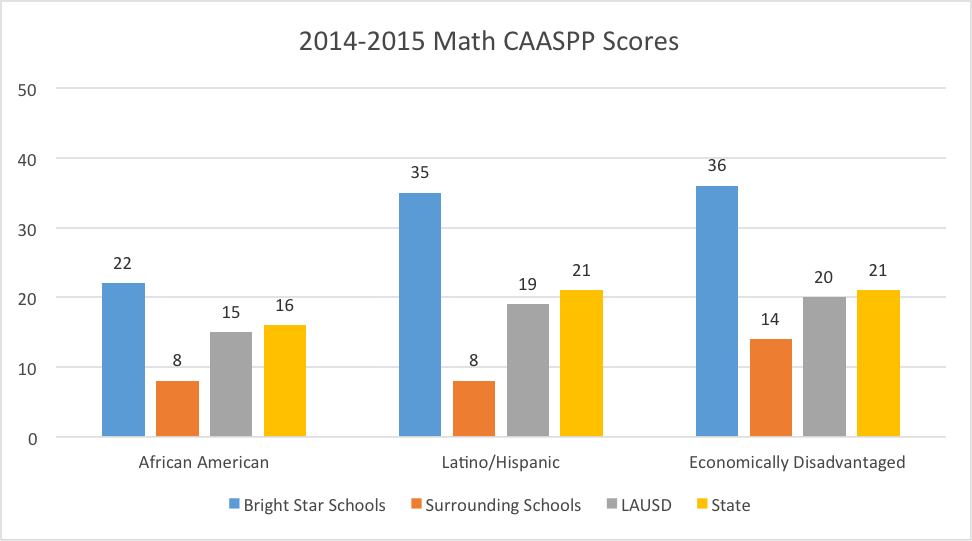
The release of the 2014-15 California Assessment of Student Performance and Progress (CAASPP) scores has provided a strong indication of the effectiveness of Bright Star’s program (see our previous blog post on this topic HERE). In order to gain a better understanding of our program’s real impact, it was important for us to drill deeper into the data and look at the significant subgroups that our schools are serving. Chart 1 and 2 below show the percentage of students who met or exceeded state standards in the subjects of English Language Arts and Math for Economically Disadvantaged, African American and Latino/Hispanic students. Bright Star’s results in serving these sub-groups are compared against the results of the surrounding schools in its communities, LAUSD, and the State of California.
Chart 1: Bright Star CAASPP English Language Arts Comparison
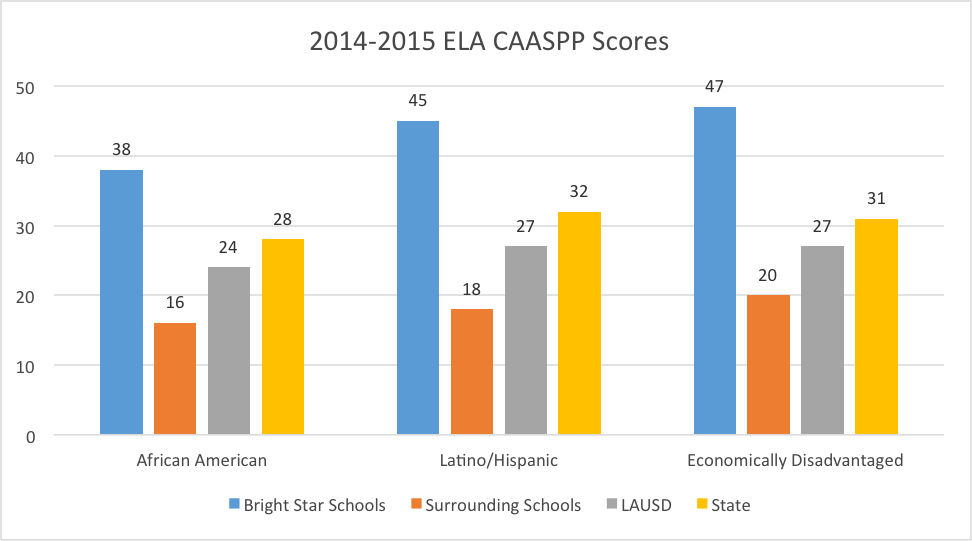
Chart 2: Bright Star CAASPP Math Comparison
In the United States and in the State of California there exists a dramatic achievement gap between low-income students and their more affluent peers. The state’s CAASPP scores have reinforced the existence of this achievement gap.
Chart 3: Reducing LAUSD Socioeconomic Achievement Gap
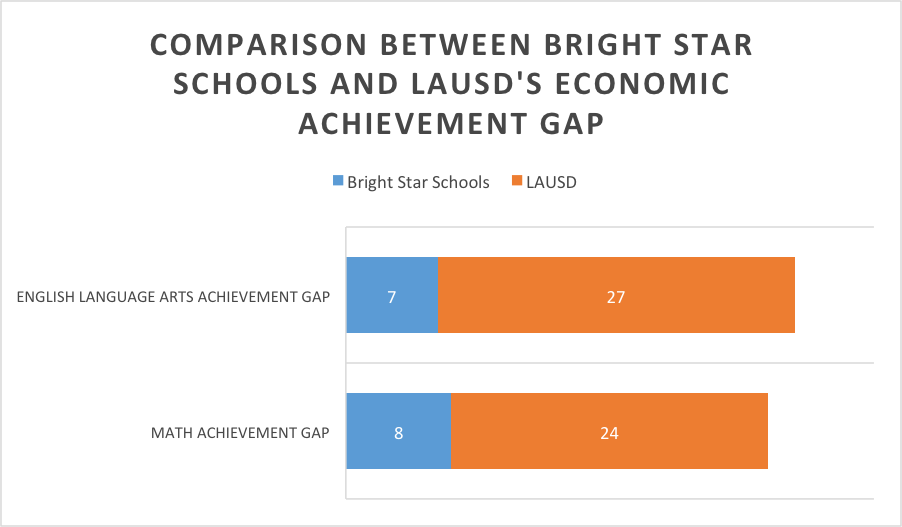
Chart 4: Reducing State Socioeconomic Achievement Gap
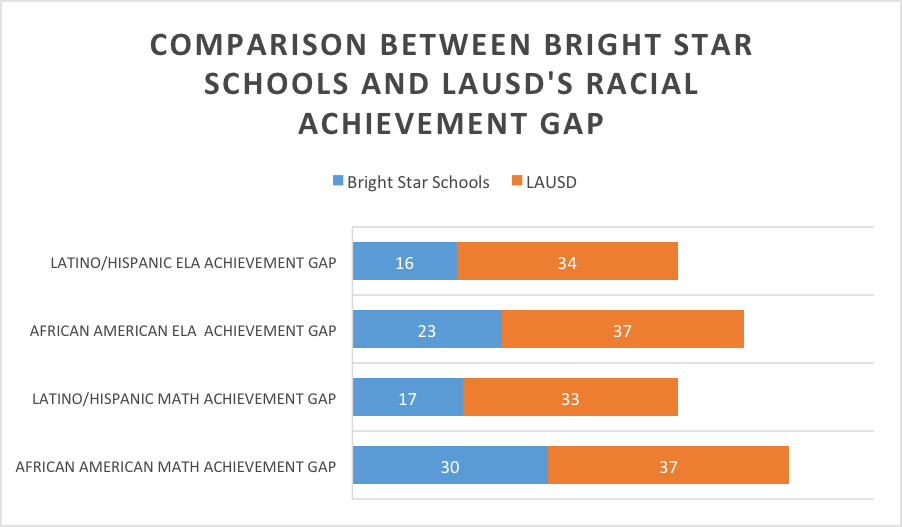
Through our results, Bright Star Schools has demonstrated that it dramatically improves educational options for low-income and minority students in the City of Los Angeles.* Chart 3 demonstrates that Bright Star Schools shrunk the performance gap between its low-income students and affluent LAUSD students by 20 percent in ELA and 16 percent in Math. Similarly, Chart 4 shows that Bright Star reduced the ELA achievement gap between African American students and Caucasian LAUSD students by 14 percent. Bright Star reduced the Math achievement gap between Latino/Hispanic students and Caucasian students by 16 percent and the ELA achievement gap by 18 percent.
When looking at Chart 1 and 2, it is also important to note that, in the absence of Bright Star schools, our students would have attended the surrounding public schools where only 20 percent of socio-economically disadvantaged students met or exceeded state standards in ELA and only 14 percent met or exceeded them in Math.
Our significant reduction in the achievement gap between our students and LAUSD students indicates both the success of the Bright Star program and the potential of our students. It is proof that, despite the additional challenges faced by our low-income and minority students, they are capable of achieving at the highest levels.
*Our results do not control for additional student demographics within these categories.